
Beat the Competition with Google’s ‘Core Vitals’ Metrics
Change is inevitable, and whether in organisations or with people we are always forced to think about how we should adapt to new situations. Websites are exactly the same, so why stay behind the curve when you can get ahead of it?
Here we explore Google’s new metrics for site speed, why you should care, and the key things you need to know about using these to improve your site.
Why should your business care?
The fact is, websites are constantly changing and evolving and it has increasingly become more important to evaluate performance for our sites. After all, if we want to be seen in a positive light from a search/user perspective we need to know how we are performing and what we can improve.
Page Speed has been a ranking signal since April 2010 and directly holds weight as to how performance is evaluated. Change occurs so quickly in our industry that something that may have been used to measure site performance at one time may no longer be relevant at another. That is where Core Web Vitals comes in.
Core Web Vitals will be the new subset of performance-based metrics measuring speed, responsiveness and visual stability which will become part of Google’s ranking signals in 2021. They will represent real-time metrics for users which will give brands an understanding of where their site currently performs.
You see, businesses face a common challenge from which they all suffer. Websites have become a necessity, and within a business, there are many different stakeholders with their own priorities who would like developers to quickly implement their tasks/priorities.
In reality, though, developers assess the stakeholders’ priorities and then decide where each task sits from an effort, scalability, and business priority. This can obviously be frustrating and problematic as with long development queues you might be unable to get SEO tasks carried out or even considered for the business.
Unlike common development issues though, Core Web Vitals should not represent a barrier as improvements around these metrics can be carried out simply and yield a high reward for the business. In fact, recent studies by Google on various mobile websites across different industries (retail, travel), demonstrated that:
- Faster sites increase conversion rate: a 0.1-second improvement of mobile site speed increased conversion rate by 8.4% for retail sites and 10.1% for travel sites. It further concluded that with the same increase that the average order value grew by 9.2%, while luxury sites saw an 8% rise in page views per session
- Faster sites ensure more customers will reach checkout (meaning more conversions): The customers will not drop off in the journey and are more likely to make it through the entire purchase funnel leading to a higher number of conversions
Needless to say, it’s important to stay ahead of the curve to meet the specific Core Web Vital criteria that Google has highlighted will be a ranking signal for sites in 2021.

As this has been publicly announced and well documented within the SEO community, it will also represent an opportunity that your competitors will be very much aware of and keen on improving. In fact, unless you’re careful, your competitors may implement the optimisations before your business gets around to it. This would give your competition a ranking advantage over your site in organic search results when the update is released. This is not something that you would want to happen, so why wait?
Managing a business site is all about adaptation and making certain you are ahead of that curve. It’s about really understanding the need to change with the industry or otherwise risk getting left behind.
Next, I will explain what Core Web Vitals is in more depth, and how you can assess if your website measures up to the competition. If you need advice on understanding what you should do next to beat the competition, feel free to contact us for more information.
How Google’s site speed metrics have evolved
Anyone who works within search engine optimisation knows how volatile and fast-paced our industry is. The new norm around how we evaluate our sites is always changing, and it is our job to make sure that we keep on top of this for our clients and ourselves, so we learn how to adapt and become better SEO’s.
Recently Google Relations lead John Mueller, Search Advocate Gary Ilyes, and Developer Advocate Martin Splitt hosted their first Podcast called “Search off the Record.” This podcast is designed to help SEO’s/developers (and really all stakeholders) get a better understanding and glimpse of how search works at Google by tackling some of the SEO community’s biggest topics.

In their first episode, the newly created Core Web Vitals Metrics were tackled in depth. Martin Splitt stated, “the new set of metrics is our best current understanding of what we consider a measurably fast website from a user and webmaster perspective.” But how did we get there?
Although it has been around for desktop-based queries since 2010, page speed has been a ranking factor since 2018 for mobile queries. It is evaluated through user-centric metrics such as Speed Index, Time to First Byte and First Contentful Paint using tools such as Page Speed Insights, Lighthouse, and Web Page Test. With the introduction of Web Vitals though these metrics are changing and it is important to understand why and how.
The search leads at Google go on to discuss the change in understanding how to measure performance for the user. One of the first things that was looked at 10 years ago was Time to First Byte. This, as we have come to learn through testing, is not a good representation of performance for the user. The web has drastically evolved from early days of plain HTML, CSS, image based sites with the introduction of Javascript functionality.
For example, if you have a site where the HTML is delivered but you are reliant on Javascript to generate the content for the page, and the server responds in 1 second, but the browser is blank while the Javascript is generating content, what does this say to the user/webmaster for measuring their experience? Sure the server responded quickly in 1 second, but the user is unable to visually see any content! How is this valuable?
This is also the case with First Contentful Paint and Speed Index, both of which have been used over the last few years to measure page speed. Upon further testing and observation, both metrics were unable to truly measure how fast a website is from a user and webmaster perspective.

For example, if a site is image-heavy but the text represents the first contentful paint on the screen and the images load 3 seconds later, what does that actually tell you about your website? Is this truly giving the user the correct perception about what speed is?
Finally, Speed Index is another metric that upon further evaluation the search team at Google found does not give a good evaluation of measuring a fast website from a user’s perspective because a visually complete site does not make the site interactive. You may load a site in 3 seconds, but if you’re unable to click and engage with the site until 6 seconds this will frustrate the user and really does not demonstrate that it has loaded quickly.
After careful consideration of the previous metrics it was decided that a new set of metrics – Core Vitals – was needed to help users and webmasters understand how measurably fast a website is.
What are Core Web Vitals?
Core Vitals are a new set of metrics utilised by Google to evaluate the quality of the user experience on the web for a site.
Google is continuously trying to better understand the web, and the Core Vitals project is an ongoing process. Google views new things happening on the web, so it attempts to measure the performance and metrics based on what it sees displayed. They want to give clear guidance to both users and webmasters about what a fast and good website is, so they’ve provided this first iteration of metrics to help give users and webmasters stable metrics to use. It is not the perfect solution but will be reviewed yearly as Martin Splitt has stated, and considerations will be made as to what needs to be changed. But for now (July 2020), Google’s first iteration of Core Web Vitals are:
- Largest Contentful Paint (LCP): measures loading performance
- First Input Delay (FID): measures interactivity
- Cumulative Layout Shift (CLS): measures visual stability
The metrics above represent a better understanding of the web and how it has developed over the years. The Largest Contentful Paint metric has evolved to take into account when the largest element has been rendered by the browser providing a far more accurate representation of user experience than complex metrics such as Speed Index and First Meaningful Paint in capturing the loading experience.
As demonstrated below, a good experience for the user is when the Largest Contentful paint is delivered before 2.5 seconds. According to the Chrome User Experience report, a good threshold to measure is the 75th percentile of page loads, segmented across mobile and desktop devices.

The First Input Delay metric represents the time calculated from when a user first interacts with the page to the time the browser responds with the interaction. This can be represented simply by the user clicking on a link to which the browser will respond to the interaction.
As demonstrated below, a good experience for the user is when the First Input Delay has occurred under 100ms. According to the Chrome User Experience report, a good threshold to measure is the 75th percentile of page loads, segmented across mobile and desktop devices.

The Cumulative Layout Shift metric measures every unexpected layout shift that occurs on the page. Mentioned within the “Search Off the Record podcast”, Martin Splitt says this was one of the key areas Google looked into and he found it quite frustrating after experiencing it across multiple sites he visited. He further explained by using the example:
- A user visits a website and believes they are able to engage with a page, i.e. to click a link
- The link moves due to Javascript manipulation of the Document Object Model on the page
- It moves further down the screen from where it was before, and the user ends up unintentionally clicking something completely different
This is quite frustrating as a user experience as the page has been made interactive but the user is unable to engage in the way they would like as the layout has shifted completely. Therefore, Google decided to tackle this through the measuring of this metric as best as they could.
As demonstrated below, a good experience for the user is when the CLS score is less than 0.1 According to the Chrome User Experience report a good threshold to measure is the 75th percentile of page loads, segmented across mobile and desktop devices.

Tools to measure Core Vitals
The tools that we are accustomed to using to evaluate user-centric page speed metrics have now been updated to incorporate the new Core Vitals metrics, allowing us to better evaluate/measure websites from a user and webmaster perspective. The following are the main 6 tools used to assess page speed for SEO:
1. Chrome User Experience Report
As still is the case for many metrics utilised before Core Vitals (to measure a fast website from a user and webmaster perspective) such as First Contentful Paint, First Meaningful Paint, Speed Index the Chrome User Experience Report continues to aggregate data across the web for both older metrics and new core vital metrics across all devices. In fact the metrics used before core vitals listed above are still valuable in helping diagnose and improve performance issues for the new core vital metrics.
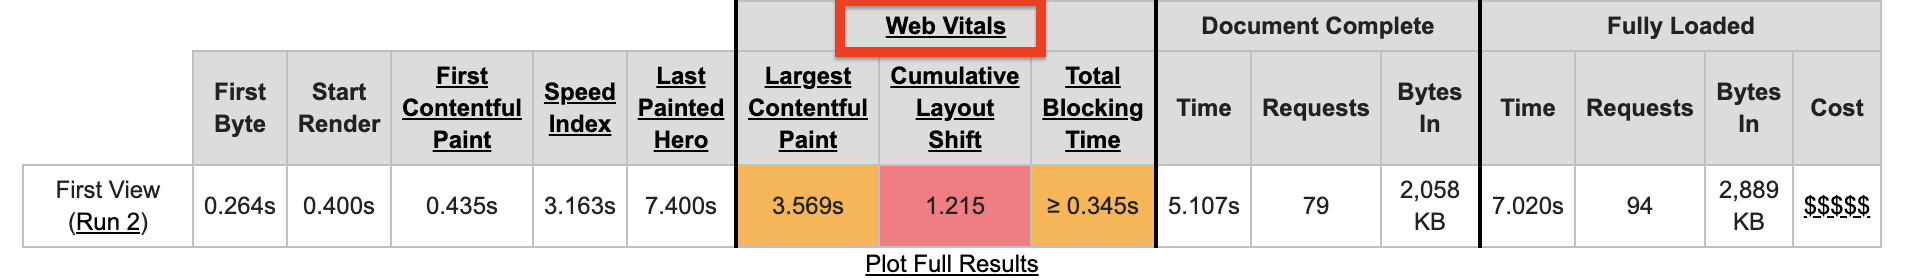
2. Page Speed Insights
Another opportunity to measure the core vitals performance can be found utilising Page Speed Insights which is powered by the Chrome User Experience Report data above. An example of what this data can look like is shown below:

Note that Total Blocking Time seen within the field data is the representation for First Input Delay and represents the same measurement.
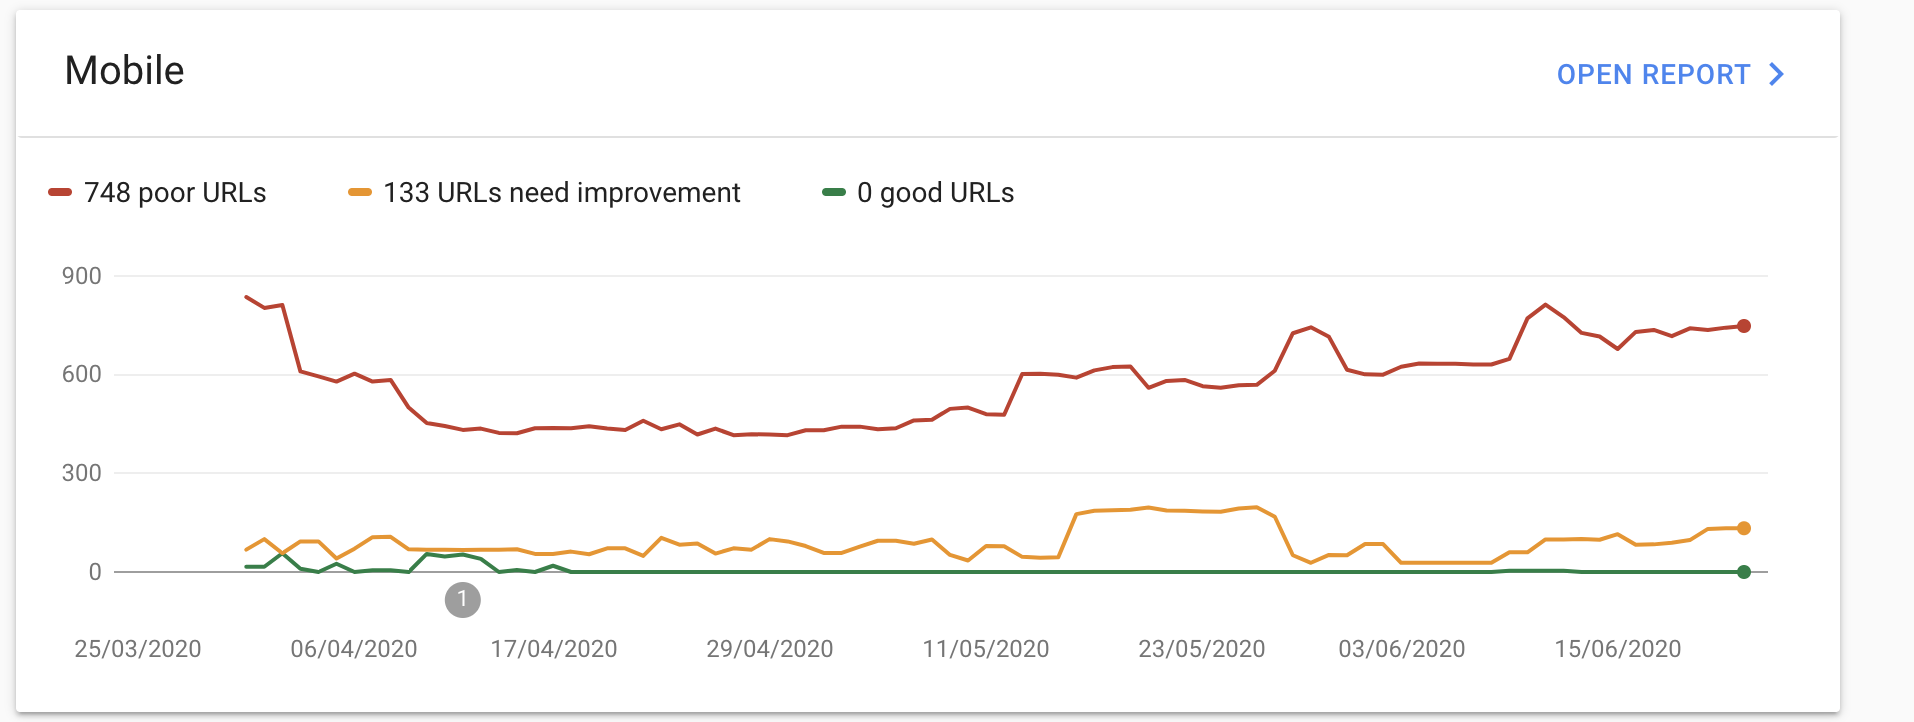
3. Core Vitals Report (Google Search Console)
You’ll also be able to measure Core Vitals performance by looking at the Core Vitals report within Google Search Console. This once again is based on Chrome User Experience Report Data. The report in search console splits out the data by the device (mobile and desktop) and by evaluation of Poor, Needs Improvement, and Good based on the metrics defined above within the core vital section:

4. Web Page Test
Web Page Test is a free online tool allowing you to run instances of performance based tests representing real time testing to help evaluate performance across a page or set of pages.
Once the page(s) have been entered and the conditions selected for the test such as a test location and connection, Web Page Test will return the tests and calculate the Core Web Vital Scores individually as demonstrated below:
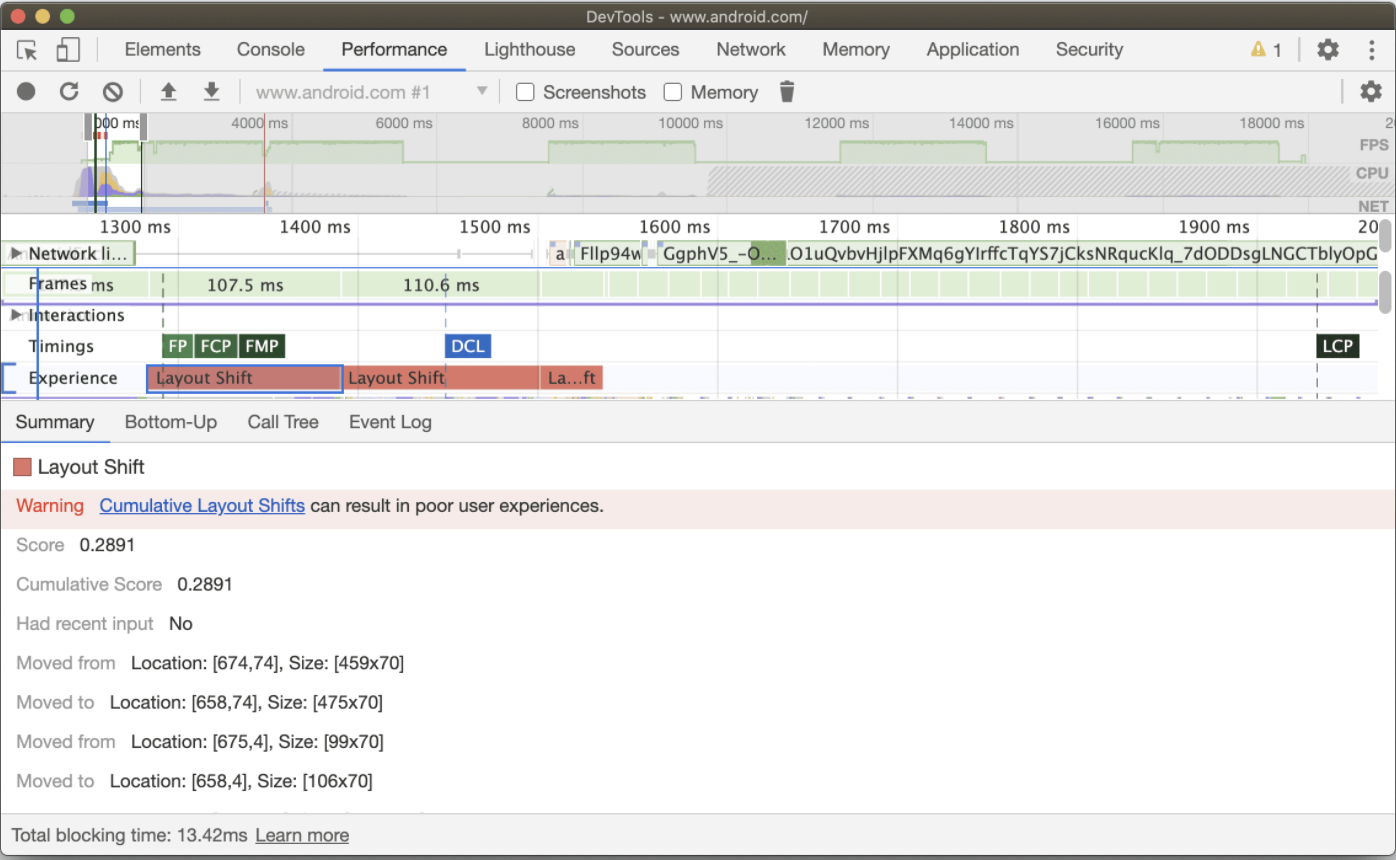
5. Chrome Dev Tools
Chrome DevTools has a performance panel which can be selected. Within the performance panel in Chrome Development tools we can measure the Core Vital Metrics demonstrated below:
6. Web Vitals Extension
The Web Vitals extension measures the Core Web Vitals metrics in real-time in Google Chrome. The extension is made readily available through the Chrome Web Store and within the projects Github repository.

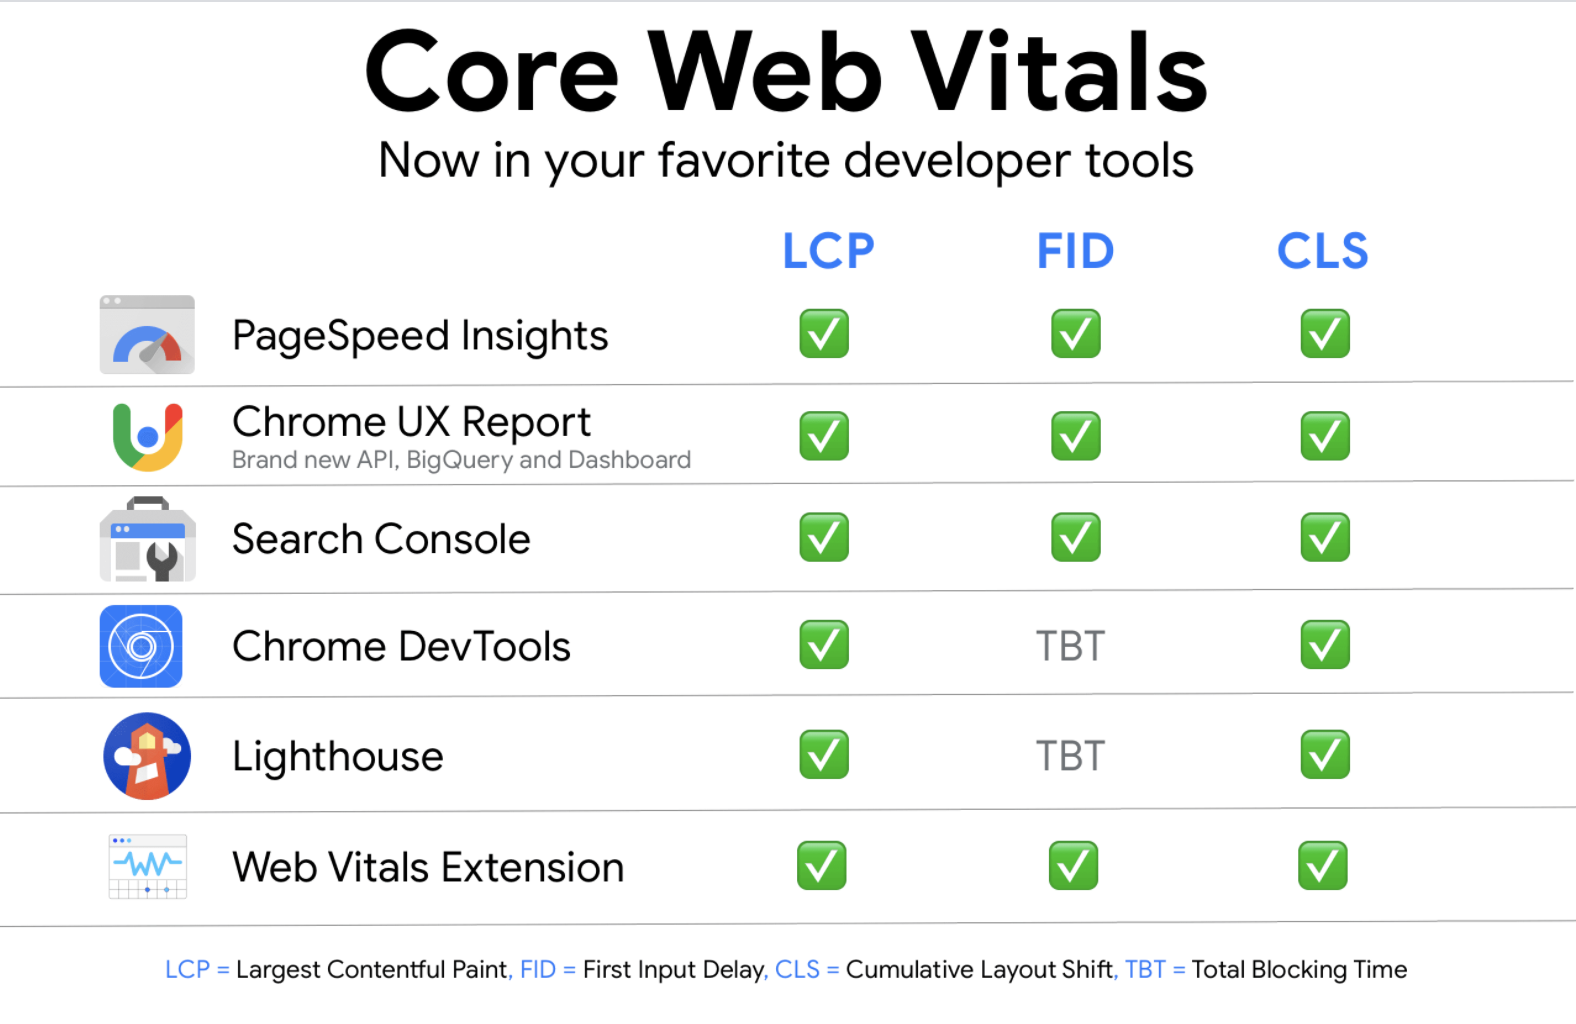
The below table displays all the tools and their metrics to help easily digest what each tool will demonstrate:
Next steps
As Core Web Vitals rolls out in a year’s time (2021), businesses need to be proactive and take action. This starts with understanding your site’s performance in comparison to competitors and the market utilising the tools discussed above. Although these metrics are not yet used for ranking signals we know they will be in the near future. Simply using the tools to diagnose the issues on their own is not usually enough, especially when any issues discovered need to be communicated to different stakeholders and eventually resolved.
In order to help you visualise what needs to be done to address any issues found, here’s a quick checklist of what to look for in these reports, and what next steps you may need to take:
- Use the Chrome User Experience Report to benchmark the performance of your competitors’ sites to understand their performance from a holistic view. Do their metrics match the Core Vitals guidelines? What do they do particularly well?
- Using the Chrome Users Experience Report or Google Search Console Core Web Vitals Report you can then holistically understand your own site’s performance across both mobile and desktop devices. You will see URLs classified as Good, Needs Improvement, or Poor
- If you select one URL within Google Search Console with the status Needs Improvement or Poor it will group all URLs under that classification
- Try to identify patterns and similar templates for these pages to make it easier for developers to implement changes in bulk
- Note if these types of pages have similar issues, such as long Javascript execution time, render-blocking resources (CSS, JS), resources taking too long to load, or client-side rendering issues
- Once you have identified the specific Core Vital Metric that needs improvement you can also diagnose issues that need to change on your site by using Page Speed Insights, which gives more granular on-page optimisations and recommendations around performance
Obviously every site is different and we can’t predict exactly what issues you will find, but the above should give you a good idea of what to do to start improving the user experience on your site.
Many of these page speed issues involve technical solutions and often require working with multiple departments and teams. However, with the right approach and knowledge, you may find that fixing these issues is actually fairly simple and often produces very positive results for the user – your customer.
Final thoughts
There are many ways to measure the three Core Vital metrics, but the measurement is never where it should stop. The goal should always be helping both users and search engines evaluate your site and pages in the best possible way.
As user expectations are changing rapidly, and subsequently so too are the expectations of search engines like Google, it is important to keep evolving and improving, and making certain your entire site is following the metric guidelines set out by Google.
For most websites, there is always room for improvement for these metrics, so the question then is – how can we improve?
The answer is not a simple one as it usually takes not only evaluation of the Core Vital metrics themselves but also the older page speed metrics, and then using these to evaluate what technical improvements need to be made to your site to deliver the required improvements.
As Google has stated, Page Speed is a ranking signal and Core Vitals will be an important aspect for both users and search engines in ranking your content in the near future.
Ayima has teams of specialists who are dedicated to helping improve the performance and page speed of our client’s websites. If you have any questions or interest in optimisations around the above please reach out to us about how we could help you further. If you are interested in the topic of Page Speed or site performance then make sure you check out my recent post on Page Speed and HTTP/2.

