Introducing our Page Speed Analytics Dashboard
In the last couple of years, we’ve seen search engines become increasingly interested in page speed as an indicator of website quality. Earlier this year, Google rolled out the Core Web Vitals update. This added more page speed and experience information into their ranking algorithm.
It’s clear that page speeds are going to be an important metric to monitor in the coming years. For us, this means being able to see how each section of your website is performing each week compared to competitors. We developed our PageSpeed Console for this purpose. In this piece, we’ll show how our clients use it to get insights into their website’s page speed experience.
Why evaluating page speed is important?
At this point, every digital marketer knows how important page speed is for SEO and user experience.
Page speed has a significant impact on user experience. The longer users have to wait for a page to load, the more likely they are to leave before converting. Nearly 70% of people polled by Unbounce said that page speed influences their likelihood to buy.
Google and Deloitte’s own research into page speed found that every 0.1 seconds improvement in load time could boost conversion rates by 8%.
The same is true of other page experience metrics related to speed, such as shifts to the layout and slow loading content.
Why is page speed important for SEO?
Page speed affects SEO because Google uses Core Web Vitals as a ranking signal. Core Web Vitals are three page speed metrics that measure how fast page content loads. These metrics are:
- Largest Contentful Paint (LCP)
- First Input Delay (FID)
- Cumulative Layout Shift (CLS)
Google uses these metrics to evaluate the quality of user experience.
Page speed analytics is an important aspect of site performance that web managers and SEOs should both monitor. All else equal, a page is more likely to rank better on the Google results page if it has better Core Web Vital metrics.
Limitations with PageSpeed Insights
While it’s possible to fetch page speed data manually from Google’s PageSpeed Insights tool, this has some major limitations:
- Not scalable
The tool examines one URL at a time, which makes evaluating multiple URLs rather time consuming. - Metrics at a glance, not over time
The tool provides a snapshot of page speed metrics. This makes it difficult to measure page speed improvements or declines over time. Equally, it makes it difficult to monitor the impact on page speed metrics from the improvements you make. - Unable to compare metrics to competitors
Because you can only test one URL at a time, you would have to run multiple tests to compare your internal page speed metrics with those of competitors. Even if you do, this would only be a snapshot, skewed by the pages you choose, and the time at which you run your test.
Google’s mobile page speed tool has similar problems.
Ayima’s Page Speed monitoring dashboard solves these issues.
How does our page speed monitor work
Our Page Speed dashboard uses Google’s Page Speed Insights API to analyze the performance of many pages across multiple domains.
We make API requests for both desktop and mobile performance metrics for a sample of internal (client) and competitor pages. Our clients have direct access to the list of tracked pages and can update these at any time by simply updating a Google sheet.
For those who are Python nerds, or simply curious, this article dives into how we interface with the Page Speed Insights API.
Our application tracks performance results in BigQuery. This lets us measure and report on changes to page speed metrics over time. We connect this warehoused data with Google Data Studio, where we build out a page speed dashboard that is tailored to the needs of each client.
We have the ability to highlight specific competitor websites in each dashboard, as well as URLs and page types. This makes monitoring page speed across your site incredibly easy.
Core elements of our Page Speed Monitor
Our page speed dashboard provides a comprehensive overview of a website’s page speed performance over time. It also plots your performance relative to your competitors.
We collect data from two sources: field data and lab data. You can find more information on these metrics and what they measure in Google’s documentation. We also have some more technical information on HTTP2 and page speed.
- Field Data
Captures real-world user data. This allows us to identify real-world bottlenecks.- Cumulative Layout Shift (CLS)
Measures visual stability. A low CLS ensures the page’s interactions are smooth and free of lag.
- Cumulative Layout Shift (CLS)
- First Input Delay (FID)
Measures load responsiveness. A low FID ensures the page is usable and that users can interact with it.
- Largest Contentful Paint (LCP)
Measures perceived load speed. A fast LCP helps reassure users that a page has enough content rendered to engage with it.
First Contentful Paint (FCP)
Measures perceived load speed. A fast FCP helps reassure users that something is happening.
In addition to the Core Web Vitals mentioned above – LCP, FID and CLS – we monitor a number of other top-level metrics, listed below:
- Lab Data
Collects data from a controlled environment. This allows for reproducible results which can be useful for debugging performance issues.- Performance Score
Uses a page’s lab data metrics to provide a summarized score.
- Performance Score
- Cumulative Layout Shift (CLS)
- Largest Contentful Paint (LCP)
- First Contentful Paint (FCP)
- Speed Index
Speed Index measures how quickly content is visually displayed during page load
- Time To Interactive (TTI)
Measures load responsiveness. A fast TTI means the page is quickly usable and interactive
- Total Blocking Time (TBT)
Measures total responsiveness. A low TBT means the page is usable and that users can interact with it.
Insights from our Page Speed Tracker
Our goal with the Page Speed Tracker is to provide insights that Google’s existing PageSpeed Insights tool could not.
We wanted the ability to track relevant metrics over time. This would let us measure the effectiveness of page speed initiatives or the impact of some change(s) to the website.
Additionally, if we only updated a certain page type, we wanted to be able to isolate those in our analysis. Similarly, we wanted the ability to look at the performance of specific device types or countries if needed.
All of these were insights that would help to give our clients the edge. These would let them make targeted changes to improve their own page speed, just as we did with our own site.
Measuring page speed performance over time, as opposed to a single snapshot, would let us determine when we are moving in the right direction. It would also show us exactly how much we were moving the needle.
It was also important that we could compare site performance to that of our competitors. Sometimes page speed metrics can look poor based on Google’s scoring system. But, if the nature of the industry requires the use of large, high-quality images or videos, it’s important for us to show this through competitor analysis. A website might be performing poorly according to Google but well relative to competitors, and vice versa.
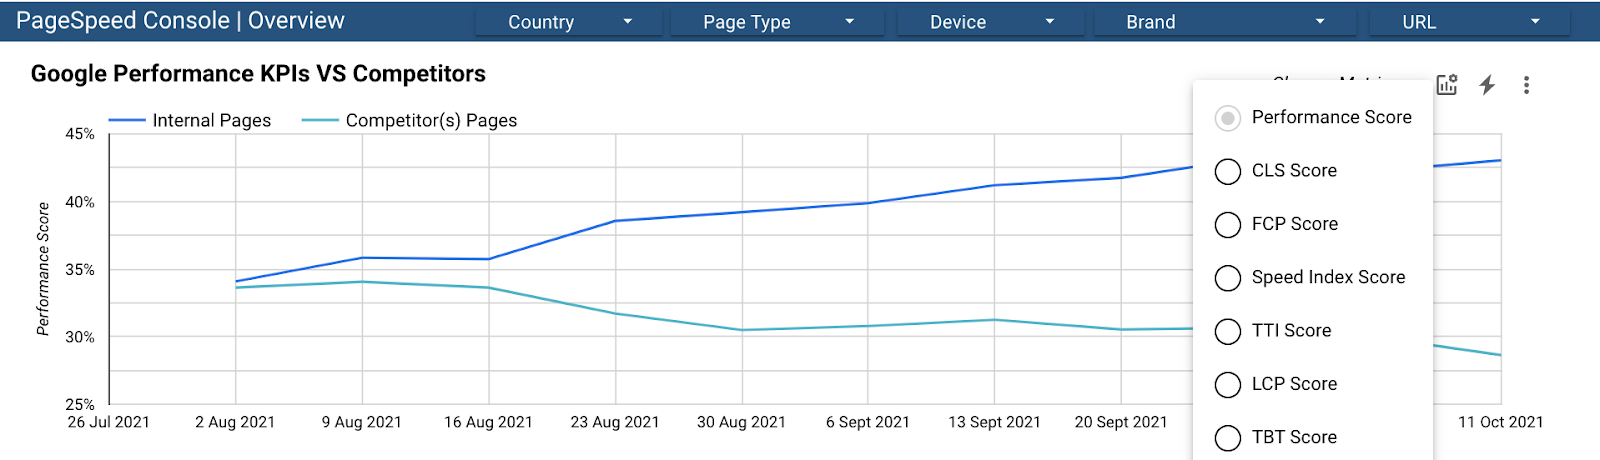
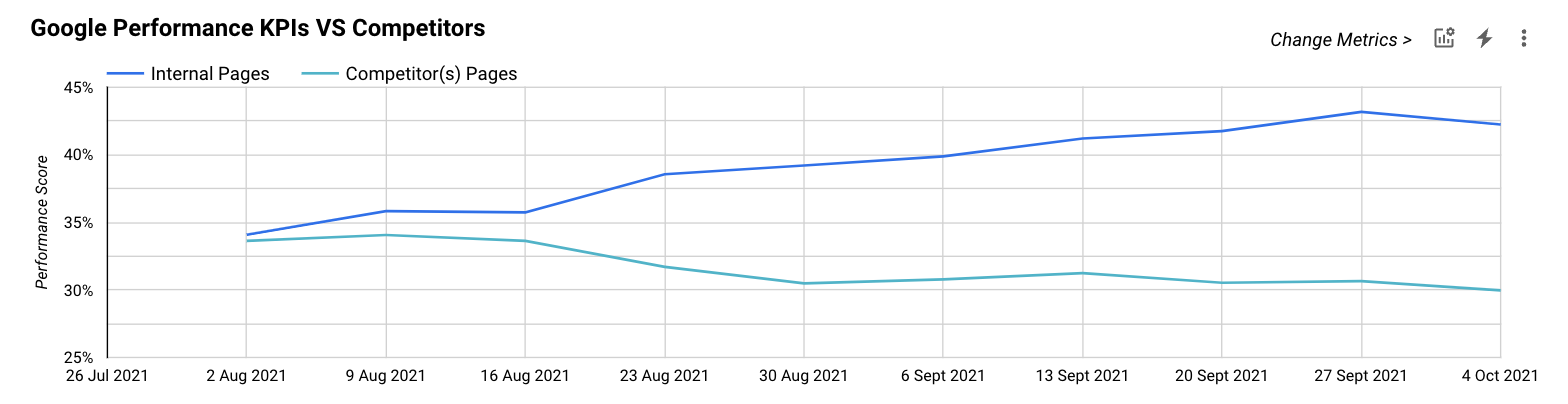
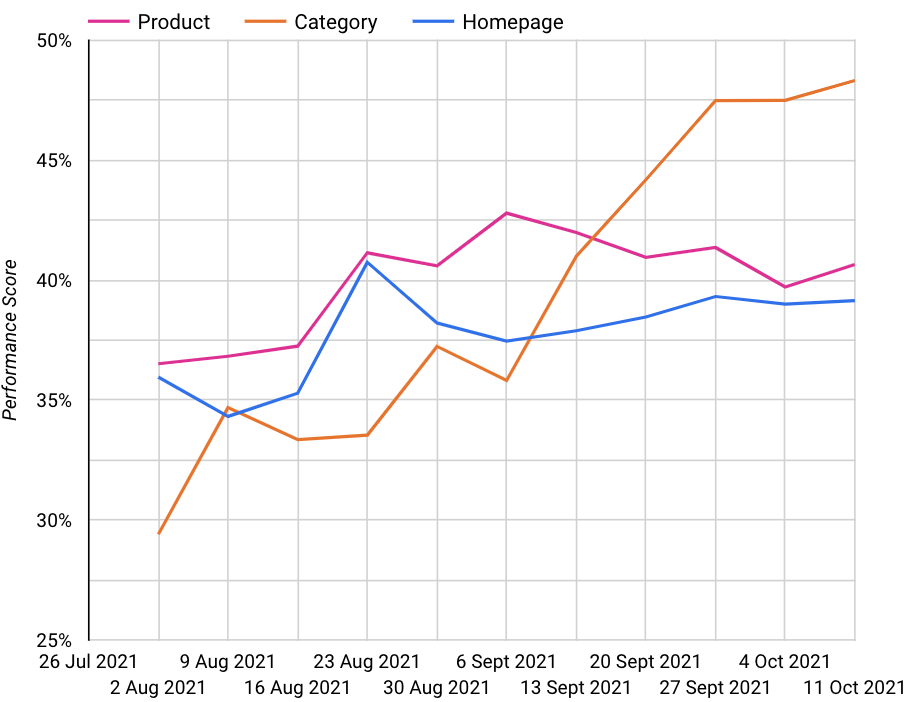
The first section of the dashboard provides a high-level overview of our client’s page speed metrics compared to competitors. A time-series chart lets us compare multiple page speed scores against competitors over time. We average the competitor data across multiple websites to provide an industry outlook on the page speed performance. We can therefore monitor the impact of site changes/migrations on site speed.

We include a more granular breakdown of core web vital metrics further down the dashboard. Similarly, we include competitor data on each chart to provide a benchmark.
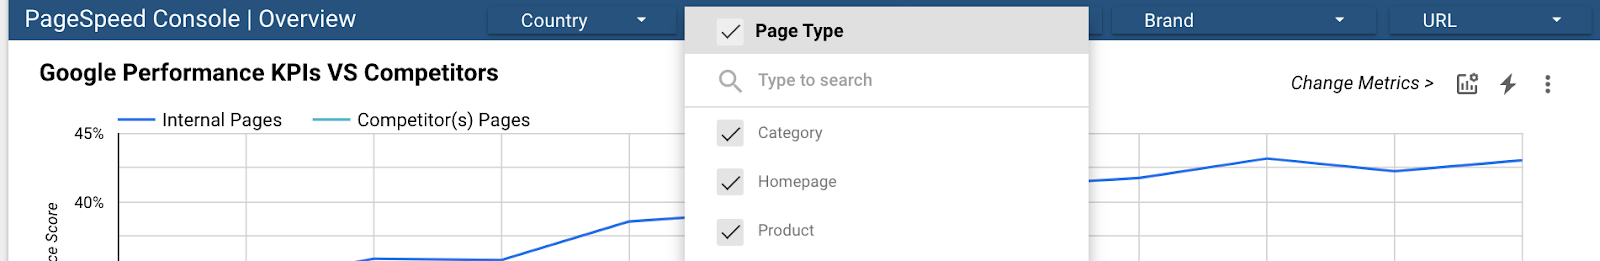
Custom filters enable us to analyze the performance of a subset of pages, countries, and/or device types, etc.

A KPI overview gives us both lab and field data metrics at a glance. Once again, we provide competitor data for each metric, which takes the average of multiple competitor websites.
We include the change from the 30-day average to show improvements or declines. Color-coding highlights easily identifiable areas for improvement. Red metrics are what Google considers to be poor, and should take precedence in any optimization efforts. Orange metrics are decent scores, and green metrics are good scores.
The Page Type and Country sections of the dashboard break down the areas of our client’s website that need improvement. These show which regions and templates have or have not been moving in the right direction.


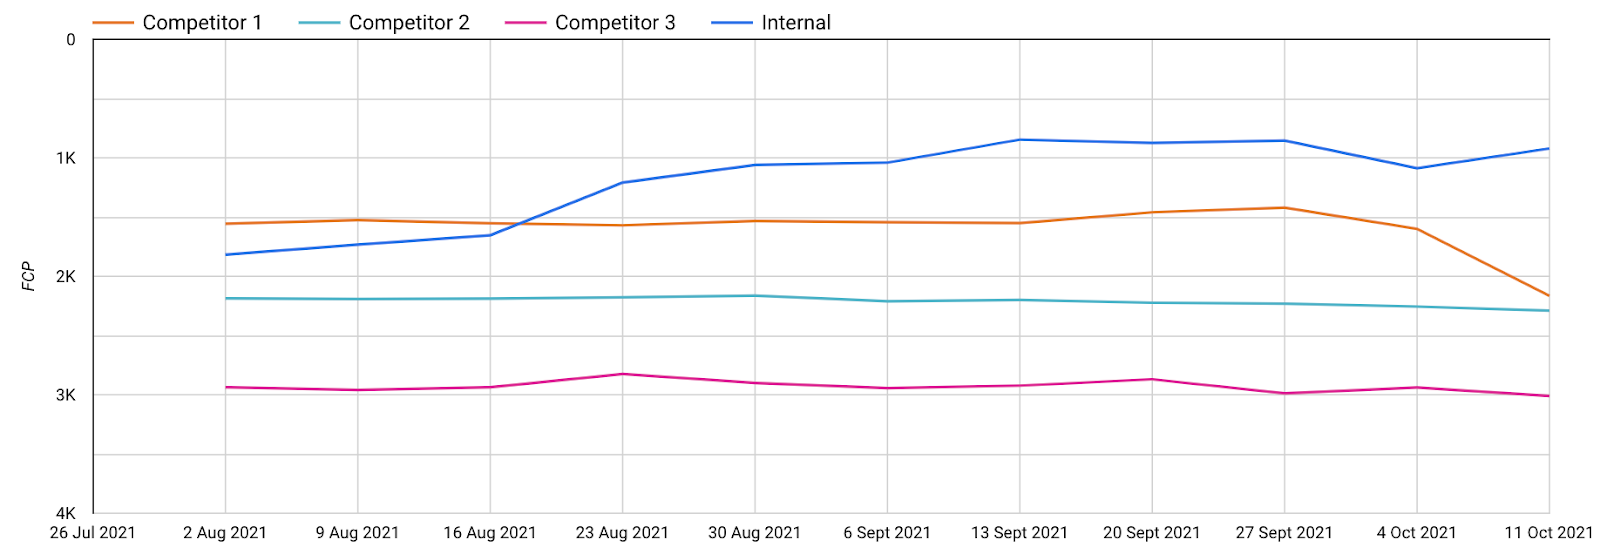
A more comprehensive competitor breakdown section lets you view page speed metrics across multiple competitors. This allows you to identify which competitor websites, in particular, are performing well and might warrant more investigation.
If a competitor gains rankings on the SERPs, we can look here to determine if it correlated with a positive change of page speed metrics. Or, if a competitor redesigns its website, we’ll be able to monitor the impact on site speed here.


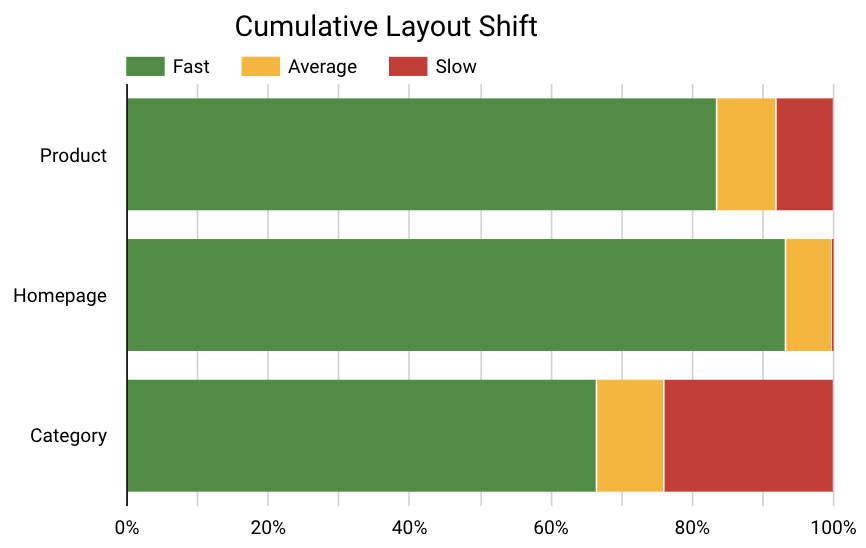
Field data charts show the percentage of users experiencing fast, average and slow metrics. Weekly averages let us view trends over time to determine the impact of efforts to improve page speed metrics.
We can make additional charts and tables to meet the needs of our clients.
How to set it up?
The Ayima PageSpeed Console is something that we provide for our SEO clients as it helps us to drive performance. Get in touch with us if you have any questions or want to learn more, we would love to hear from you!

